This week, the reading and the assignment should help you think about presenting your data as clearly as possible.
(1) Reading.
The reading this week is long,
but should go quickly: Chapter 2
of Bill Cleveland's book The
Elements of Graphing Data.
(optional)
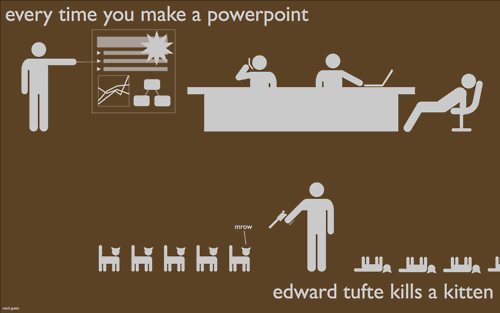
After reading that, you'll enjoy doing the graph design quiz on Stephen Few's website. He also has a few neat (and short!) articles under "Featured Articles" here. It's worth it to poke around for a few minutes - you'll never be tempted to use unit graphs again!
(2) Make your own visualization.
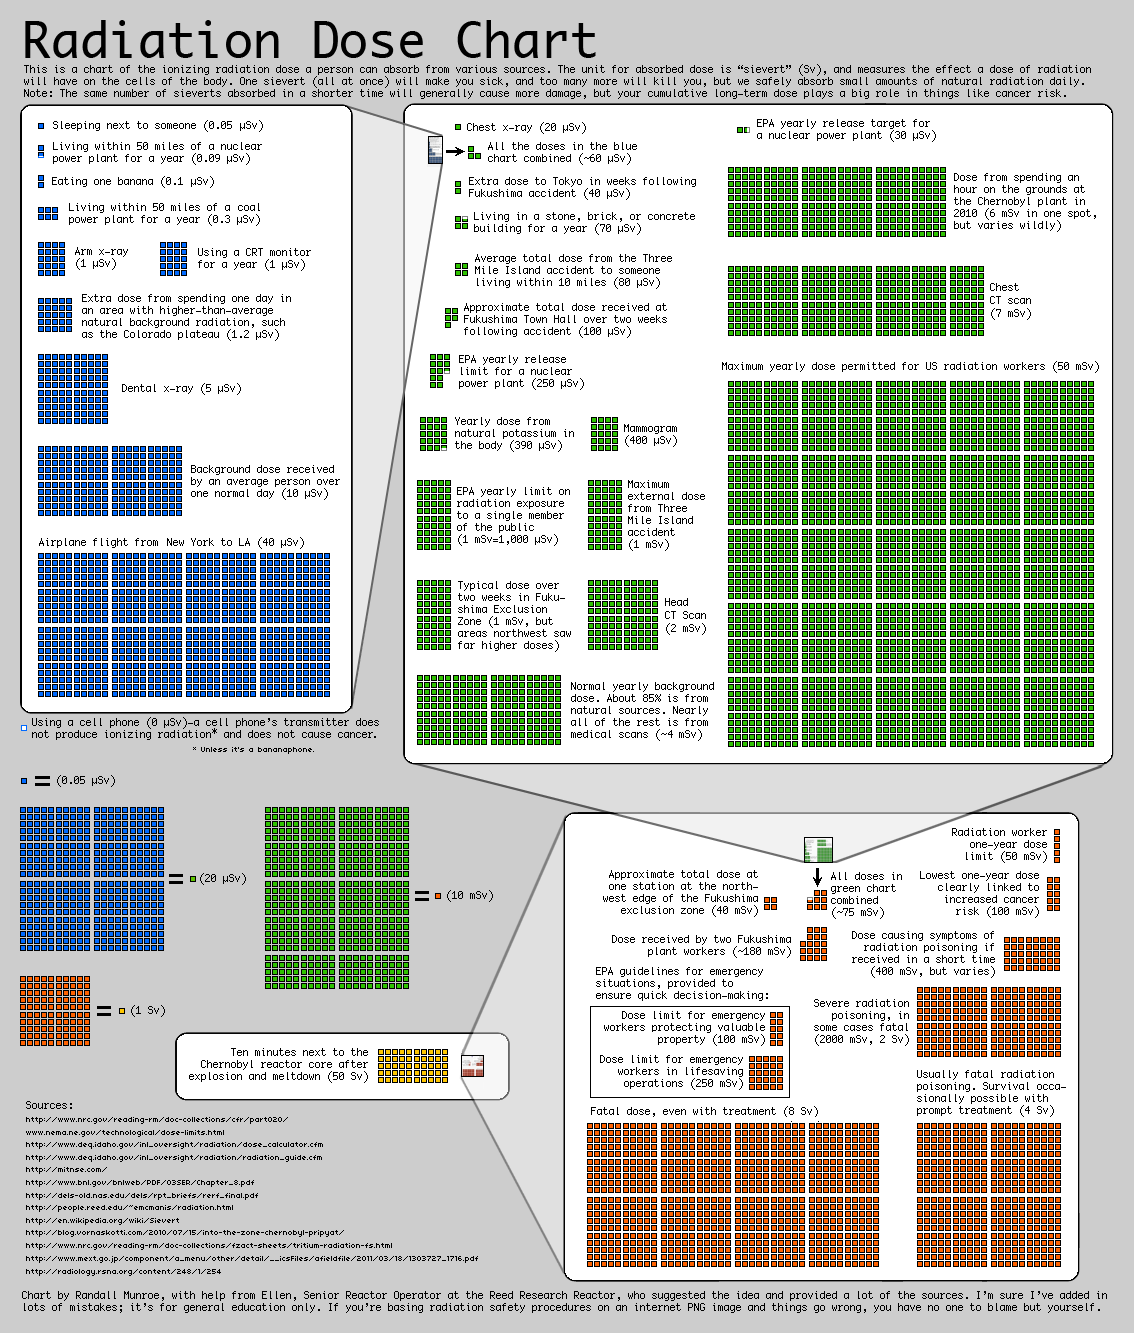
As you know, in March the Fukushima Daiichi nuclear power plant suffered a partial nuclear meltdown following a large earthquake offshore. Please present an interesting visualization that conveys the risks posed by this event.
You may use this dataset, which records radiation levels in Tokyo, 150 miles to the south. (To understand the format of the data, it came from this website and is explained there). It contains max, min, and average radiation levels for each hour period from 3/15-4/24.
You may wish to visualize the data in more than one way - that's fine, you can turn in several different "plots" if you want. Feel free to move beyond the confines of a traditional "bar/plot/line graph/..." sort of presentation. (Even XKCD has thoughts on this!) You're encouraged to seek out additional data on the web, but please include any sources and raw data with your submission.
Next week, plan to spend a few minutes in class presenting your visualizations. If you would prefer to submit them in hard copy (ie, if you're doing any illustrations by hand etc.) you can turn them in to the TA in class.
(3) Continue working on your projects.
Keep in mind that your preliminary data will be discussed in class May 20th - so you should have at least some results to present by then. For instance, if you're doing an experiment which takes several weeks to complete, you may only have data for the first few weeks. If you're doing an experiment which requires many subjects, your results may show just a small number of the total participants you hope to get. That's fine!
Blogs: Please continue updating your blogs! I'll be checking in from time to time, as will your classmates.
Buddies: Continue to keep an eye on your buddy. If you find yourself stuck or wanting to discuss some aspect of your experimental design, you may want to check in with them.
The rest of the class: At some point in the next 3 weeks, we'd like everyone to make thoughtful, constructive comments on at least 6 of the blogs of the rest of the class. Get started early, because who knows - if you give valuable feedback now, you might even save a classmate from making poor decisions that can't be refined later. You can find links to all your classmate's blogs here.
What to submit:
(0) What was your favorite
example figure in the reading? Why?
What did you disagree with? Do you think this book feels relevant?
(1) Your visualizations (if digital, otherwise hand in at class)
(2) A brief update on your project (use your blog, but put the link in your email.)
What did you disagree with? Do you think this book feels relevant?
(no reading summary required this
week)
(1) Your visualizations (if digital, otherwise hand in at class)
(2) A brief update on your project (use your blog, but put the link in your email.)