1. Practice graphing data using R
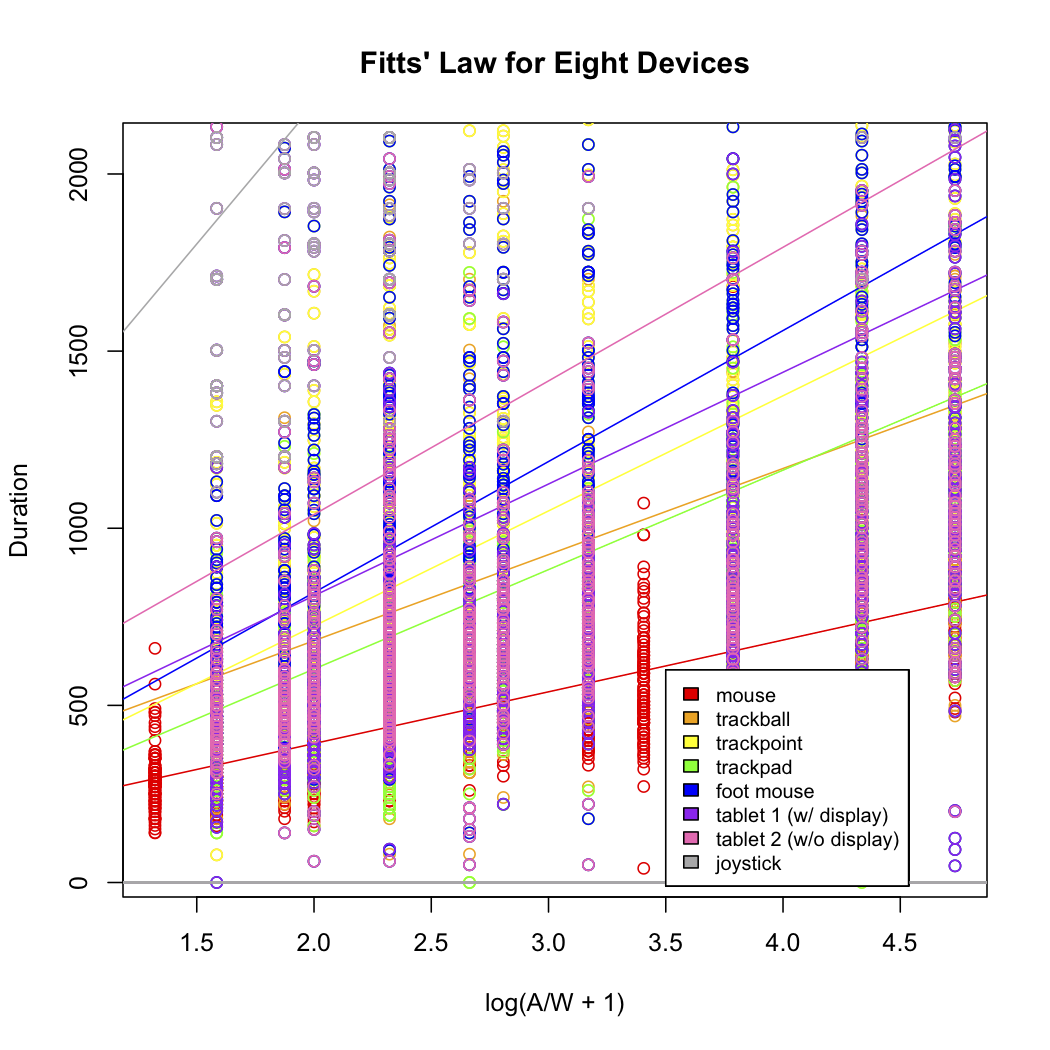
Recreate this figure (shown in class) which plots the input device data from our Fitts' Law experiment.
Before getting started, you might find the following resources useful:
- Norman Matloff at UC Davis has written this introduction, which is geared towards programmers.
- There's also this page from Illinois State with many examples of R's graphing capabilities, as well as how to input data files and perform basic statistical tests.
- This is the standard R introduction.
- Stanford's CS109L is also a valuable resource.
Click here to download the class dataset from the in-class experiment we performed last year. This file contains a compilation of the data files from each experimental trial.
Once imported into R, you'll find that every entry has associated with it a (slightly confusingly named) header called "Subject" containing information about the device number and the participant. The numbers "YY" identify the human participant; the number "X" identifies the device they were using. In particular, we have:
| "Subject" field in the form: | Corresponds to this device: |
| 1-- | mouse |
| 2-- | trackball |
| 3-- | trackpoint |
| 4-- | trackpad |
| 5-- | foot mouse |
| 6-- | tablet with display |
| 7-- | tablet without display |
| 8-- | joystick |
For example, an entry containing a "Subject" field of "645" corresponds to an experimental trial where participant #45 used the tablet with a colocated display (that is, device number 6.)
Hint: You might find the following R operators helpful in selecting data entries of interest:
quotient - %/% (example: 11%/% 5 = 2)
remainder - %% (example: 11%%5 = 1)
2. Propose 2-3 experimental questions.
We'd like you to practice thinking of good experimental questions. Come up with 2-3 ideas for experiments that you might be able to conduct in the context of this class, and describe them using one paragraph for each idea. If you've had ideas about what kinds of projects you might want to explore in this class, this is your opportunity to get some feedback.
Writer's block? See:
McGuire: Creative Hypothesis Generating in Psychology
3. Read the paper to be discussed next week.
Please read the paper with a special eye towards its experimental design.
a) Begin by reading this explanation of the background details.
b) Then read the full paper: Aguayo et al.: Link-level Measurements from an 802.11b Mesh Network.
To submit your completed assignment:
Please
attach a PDF of your graph
from part 1 to an email containing your experimental ideas from part 2.
Then, send that email to cs303[at]cs.stanford.edu.
Questions?
Please feel
free to contact the
TA for clarifications on the assignment.